I thought this was a great chart from the Cromford Report published on Saturday, 5/3/14:
"Let us examine the contract ratio by price range to see which sectors are warming up and which are cooling off. This is for single family detached homes and compares May 1, 2014 with April 1, 2014 and with May 1, 2013.
| Price Range | May 1, 2013 | April 1, 2014 | May 1, 2014 | 1 month change | 1 year change |
| Under $25K | 363.6 | 125.0 | 75.0 | -40% | -79% |
| $25K-$50K | 380.8 | 124.2 | 168.8 | +36% | -56% |
| $50K-$75K | 326.7 | 92.9 | 87.5 | -6% | -73% |
| $75K-$100K | 293.8 | 86.3 | 90.3 | +5% | -69% |
| $100K-$125K | 287.5 | 98.2 | 94.7 | -4% | -67% |
| $125K-$150K | 199.9 | 76.1 | 73.7 | -3% | -63% |
| $150K-$175K | 161.6 | 61.1 | 63.0 | +3% | -61% |
| $175K-$200K | 134.5 | 48.4 | 53.6 | +11% | -60% |
| $200J-$225K | 140.7 | 49.5 | 52.4 | +6% | -63% |
| $225K-$250K | 115.4 | 43.8 | 48.0 | +10% | -58% |
| $250K-$275K | 113.3 | 42.9 | 46.1 | +7% | -59% |
| $275K-$300K | 102.0 | 39.6 | 40.1 | +1% | -61% |
| $300K-$350K | 88.7 | 34.3 | 33.7 | -2% | -62% |
| $350K-$400K | 78.1 | 29.8 | 28.7 | -4% | -63% |
| $400K-$500K | 62.7 | 29.1 | 28.6 | -2% | -54% |
| $500K-$600K | 48.5 | 24.8 | 24.6 | -1% | -49% |
| $600K-$800K | 45.2 | 20.9 | 22.7 | +9% | -50% |
| $800K-$1M | 32.3 | 19.3 | 17.0 | -12% | -47% |
| $1M-$1.5M | 23.5 | 17.8 | 17.3 | -3% | -26% |
| $1.5M - $2M | 20.9 | 17.9 | 16.9 | -5% | -19% |
| $2M-$3M | 14.1 | 13.4 | 11.8 | -12% | -16% |
| Over $3M | 6.9 | 6.1 | 5.4 | -12% | -22% |
The cooling of the market over the last 12 months is very obvious in this table."
As a reminder, the Michael Orr of the Cromford Report defines that the Contract Ratio indicates how "hot" a market is. It specifically measures the number of completed sales contracts relative to the supply of active listings. It is defined as 100 x (Pending Listings + UCB Listings) / Active Listings Exclusing UCB. The higher the number the greater the buying activity relative to supply. Notice that from about $150,000 to $275,000 we're seeing an increase. It also ticked up substantially in the $600,000-800,000 range. Most of the buyers who were fueling the upper end ($1M-1.5M & $2.5M+) were likely seasonal buyers who've moved on now that the weather is heating up.
For fun, we can take a look at how that compares to the Cromford Market Index for a few cities: Phoenix, Scottsdale, Tempe & Chandler:
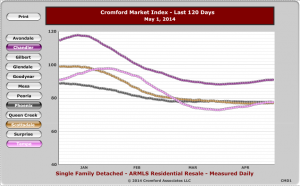
What I infer from this info is that if you have a home to SELL in the $150-300K range, you might be in better shape for the latter part of the spring. If you plan to BUY a home in this range, you might want to be prepared for a little more competition by getting your financing in order and watch carefully for new listings and price reductions. Same goes for the $600-800K range. At all of the other price ranges, SELLERs be patient. BUYERs, you will have quite a few options from which to choose, so bear that in mind.
Regardless of what you do, having the best representation is key, so CALL ME at 602-810-1750 for sound guidance and a seamless transaction!